
How many real images are generated images worth?
A few real images of one setup, generated data for the rest. Two tests show how many real images are still needed: to train a detector from scratch, and to keep it working when the setup changes.
Collecting and labelling real images takes time, for every part and every setup.
A detector learns what it is shown. Move to another carrier, change a light or pile more parts together, and it starts missing parts.
The setup in this case study has three parts, two carriers and 13 camera angles. Every new carrier or light means another set of images to take and label by hand before the detector can be trusted again.
The usual fix is another round of data collection. This case study asks a different question: how many of those real images can generated images replace?
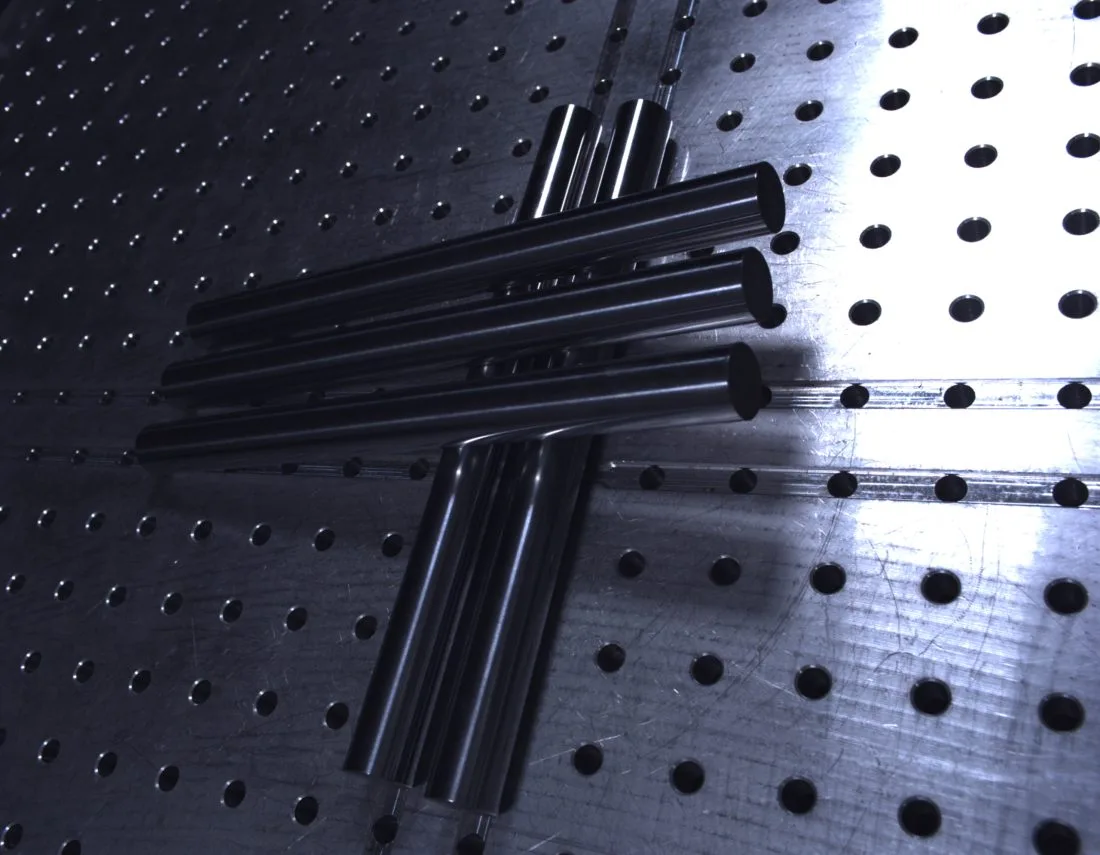 Real scenes · carriers, parts and camera angles keep changing
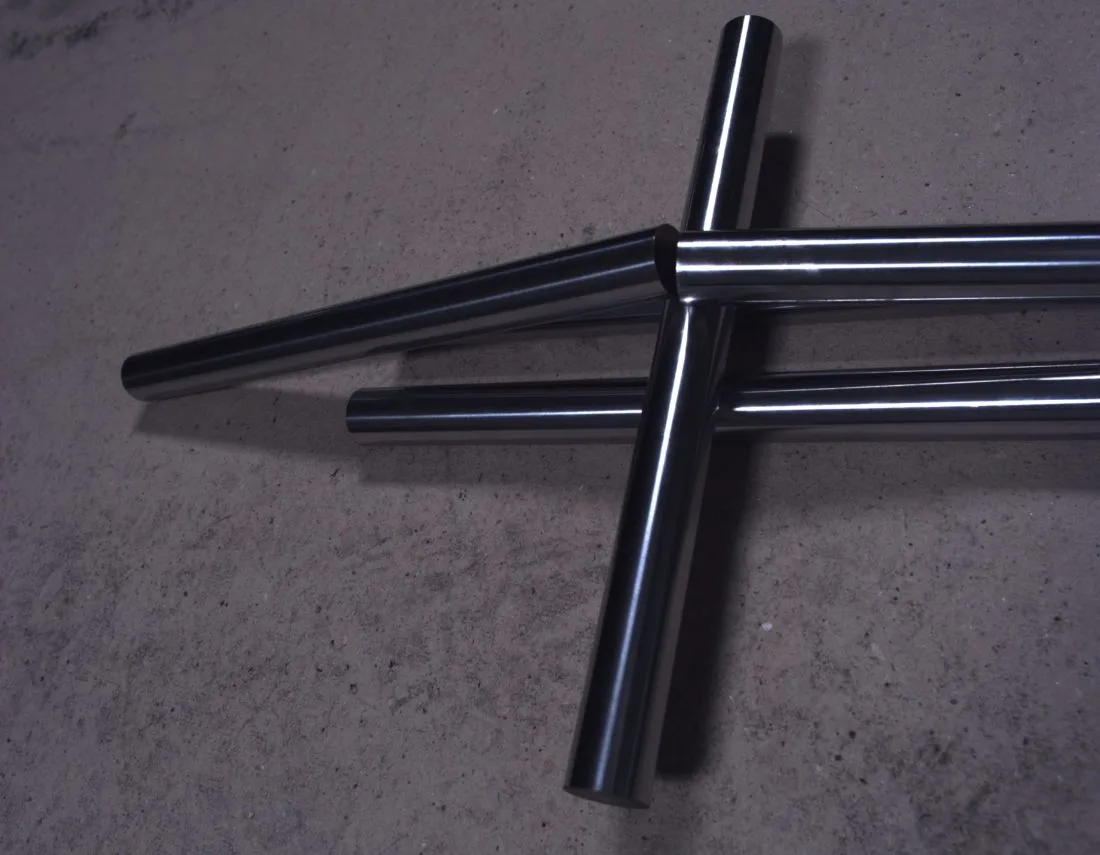
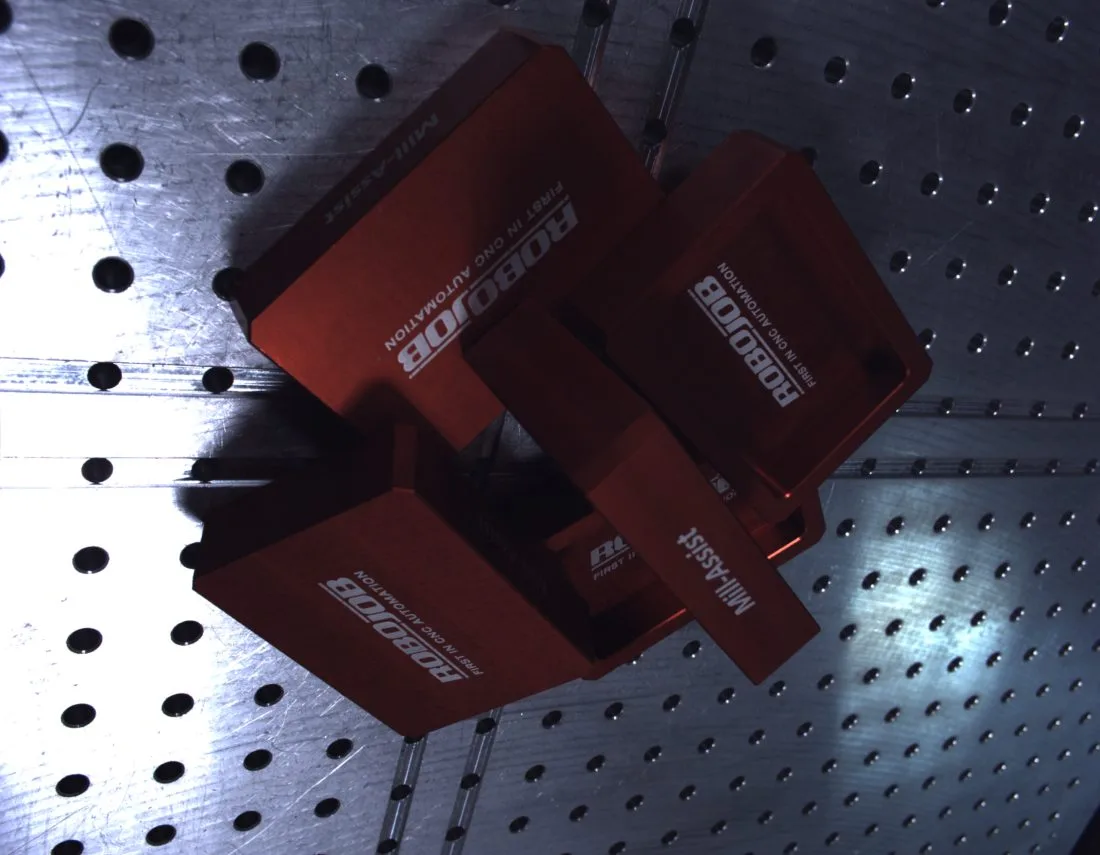
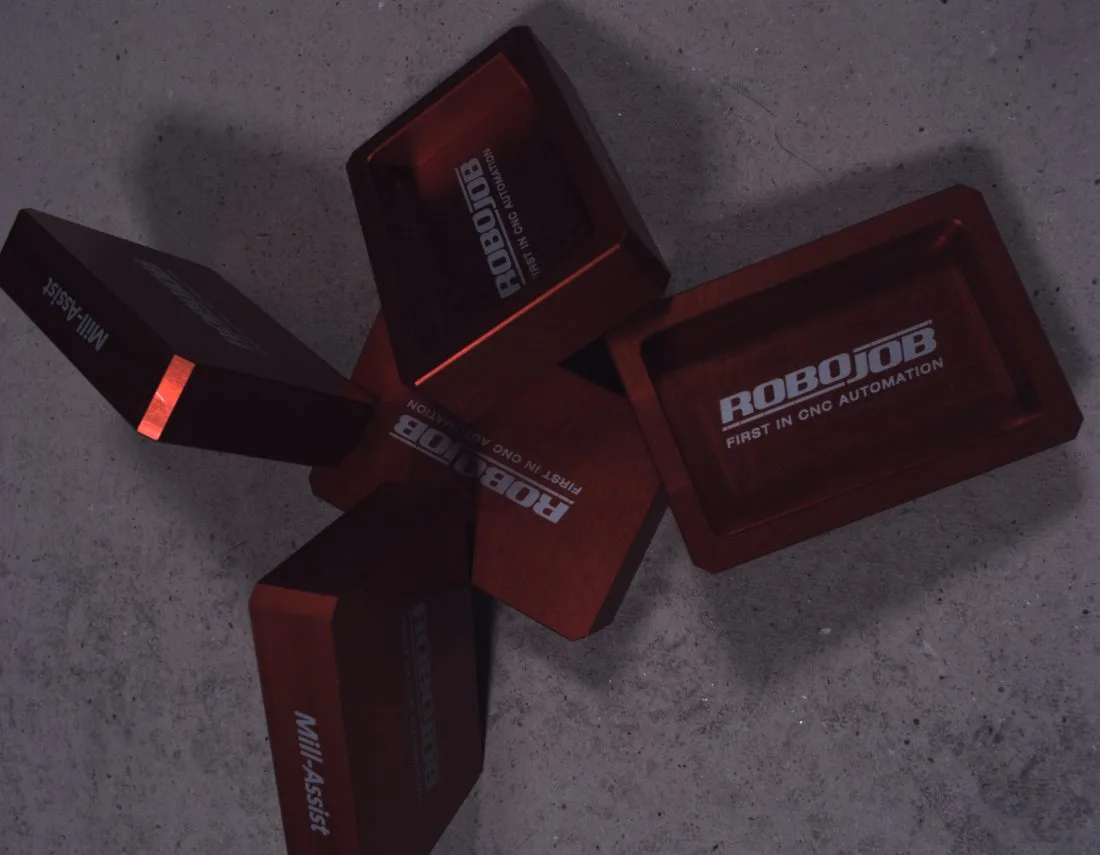
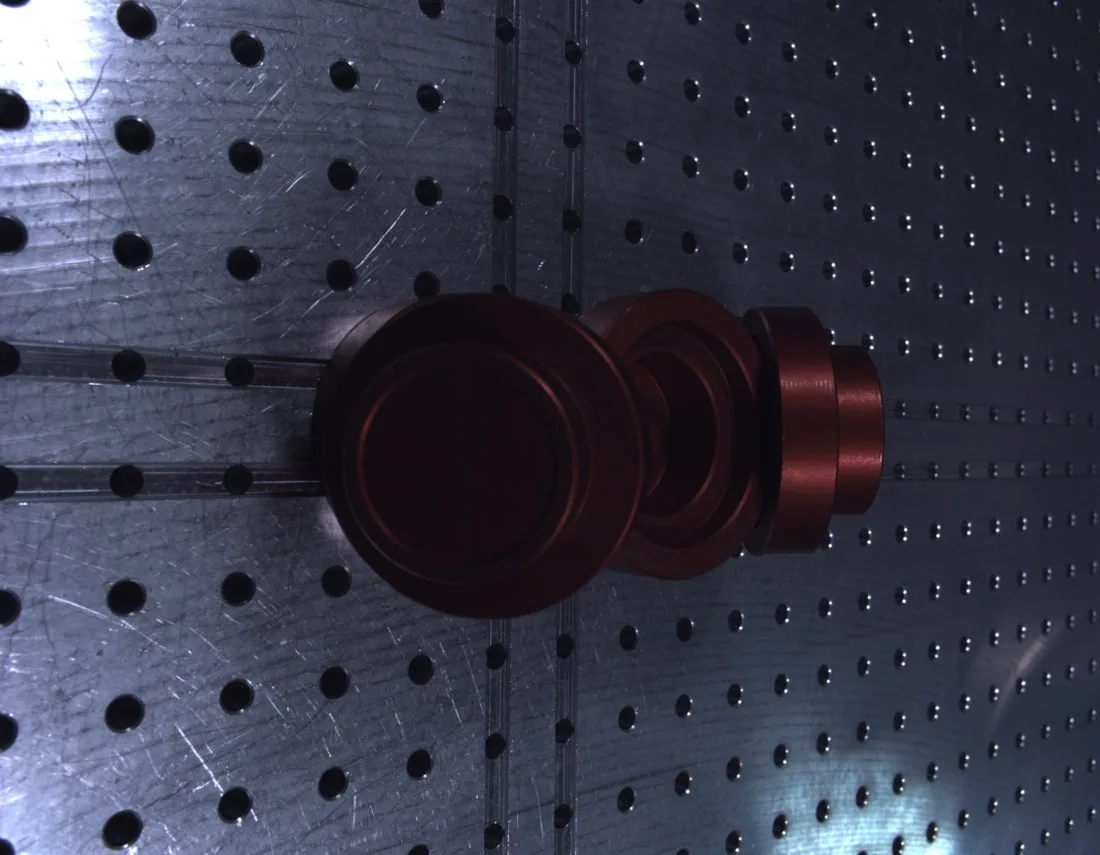
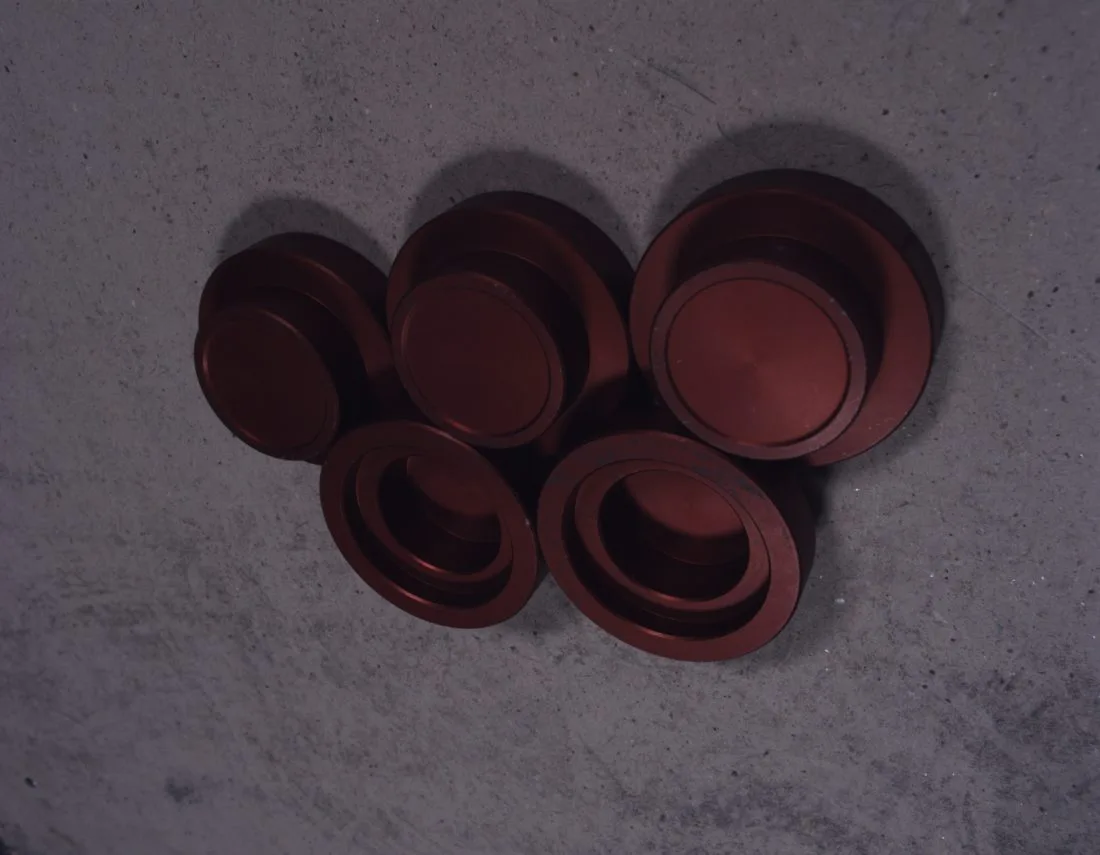
Two scenarios, one result: generated images can replace real images.
15 real images plus generated images beat 120 real images.
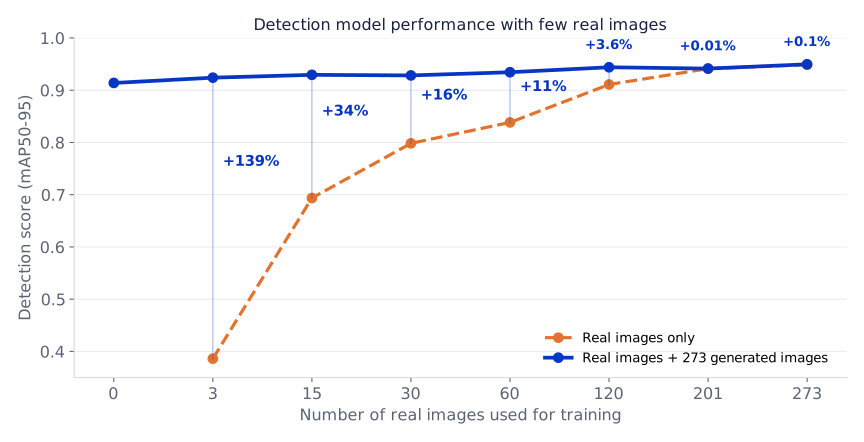
Scenario 1 investigates how many real images are needed to train a detector from scratch when combined with generated images. Training starts with just 3 real images, one per part, and more real images are added step by step up to all 273. Each step is repeated with 273 generated images added. Without generated images, the detection score starts low and only catches up with many real images; with them, it is above 0.92 from the first 3 real images.
More in-depth numbers for scenario 1
| Training data | Detection score (mAP50-95) | Parts missed | False detections |
|---|---|---|---|
| All 273 real images + 273 generated images | 0.950 | 1 | 1 |
| All 273 real images | 0.949 | 1 | 0 |
| 273 generated images only (no real images) | 0.914 | 2 | 2 |
| 120 real images | 0.911 | 3 | 3 |
| 15 real images + 273 generated images | 0.929 | 3 | 0 |
| 15 real images | 0.694 | 26 | 11 |
| 3 real images + 273 generated images | 0.924 | 2 | 6 |
| 3 real images (one per part) | 0.386 | 90 | 2 |
A new carrier: generated images alone close 90% of the gap.
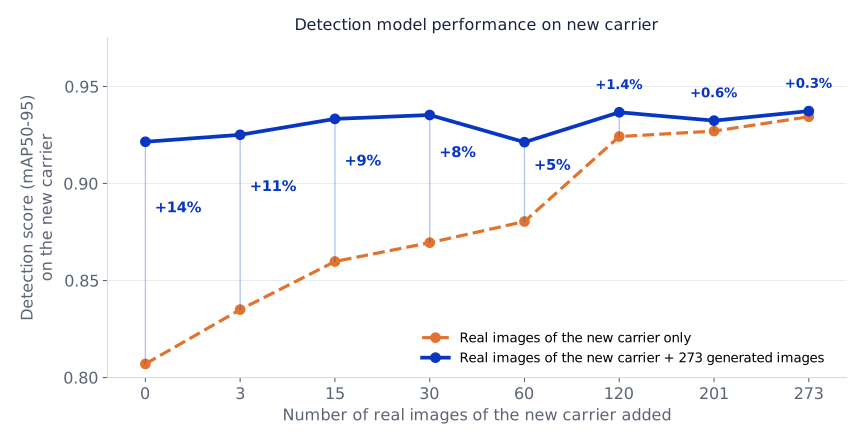
Scenario 2 investigates whether a change of carrier requires collecting new real images, or whether one can rely on carrier-specific generated images only. A detector trained on 273 real images of the old carrier is moved to a new one, where it drops from 0.949 to 0.807. It is first fine-tuned with 273 generated images of the new carrier only, then real images of the new carrier are added step by step, with and without the generated images, to see how many new real images would be needed.
More in-depth numbers for scenario 2
| Added to the old-carrier detector | Detection score on the new carrier (mAP50-95) | Parts missed | False detections |
|---|---|---|---|
| Nothing (old-carrier detector as is) | 0.807 | 21 | 13 |
| 273 generated images of the new carrier | 0.921 | 8 | 1 |
| 15 real images of the new carrier | 0.860 | 8 | 10 |
| 15 real images + 273 generated images | 0.933 | 7 | 4 |
| All 273 real images of the new carrier | 0.934 | 7 | 2 |
| All 273 real images + 273 generated images of the new carrier | 0.937 | 5 | 1 |
How we measured these numbers
Scenario 1: 39 real test images (one per part for each of the 13 camera angles), 158 parts in total, never used for training or tuning. All images: pegboard, second lighting setup.
Scenario 2: 39 real test images of the new carrier, 156 parts in total, never used for training or tuning. Every row starts from the old-carrier detector and keeps its 273 real training images. Old carrier: pegboard; new carrier: speckled board; second lighting setup.
The 90% figure: on the new carrier, the old detector scores 0.807. All 273 real images of the new carrier raise it to 0.934, a gain of 0.127. The 273 generated images alone raise it to 0.921, a gain of 0.114, which is 90% of the gain from real images (0.114 / 0.127).
Both scenarios: detection model YOLO26s. Detection score is mAP50-95. Parts missed and false detections are counted at a confidence threshold of 0.5. Reference boxes for the real images were generated from the parts' CAD models and the measured part positions rather than drawn by hand, so the scores measure agreement with those references. Each configuration was trained once. Real images from the DIMO dataset.
The same configuration producing a real image and a generated image
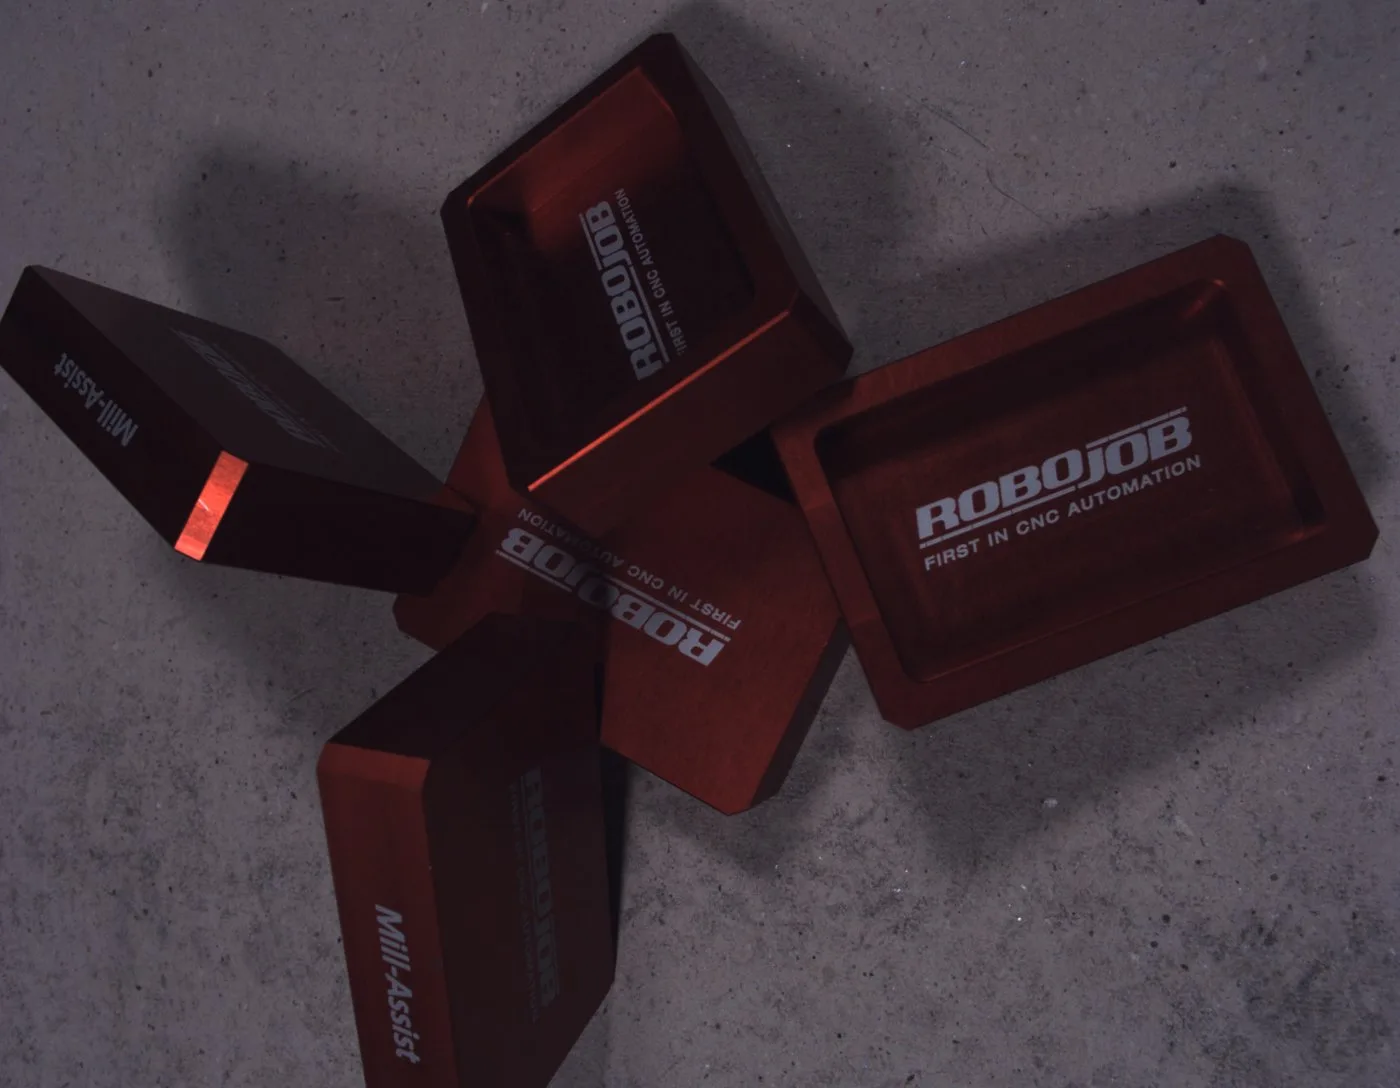 Real
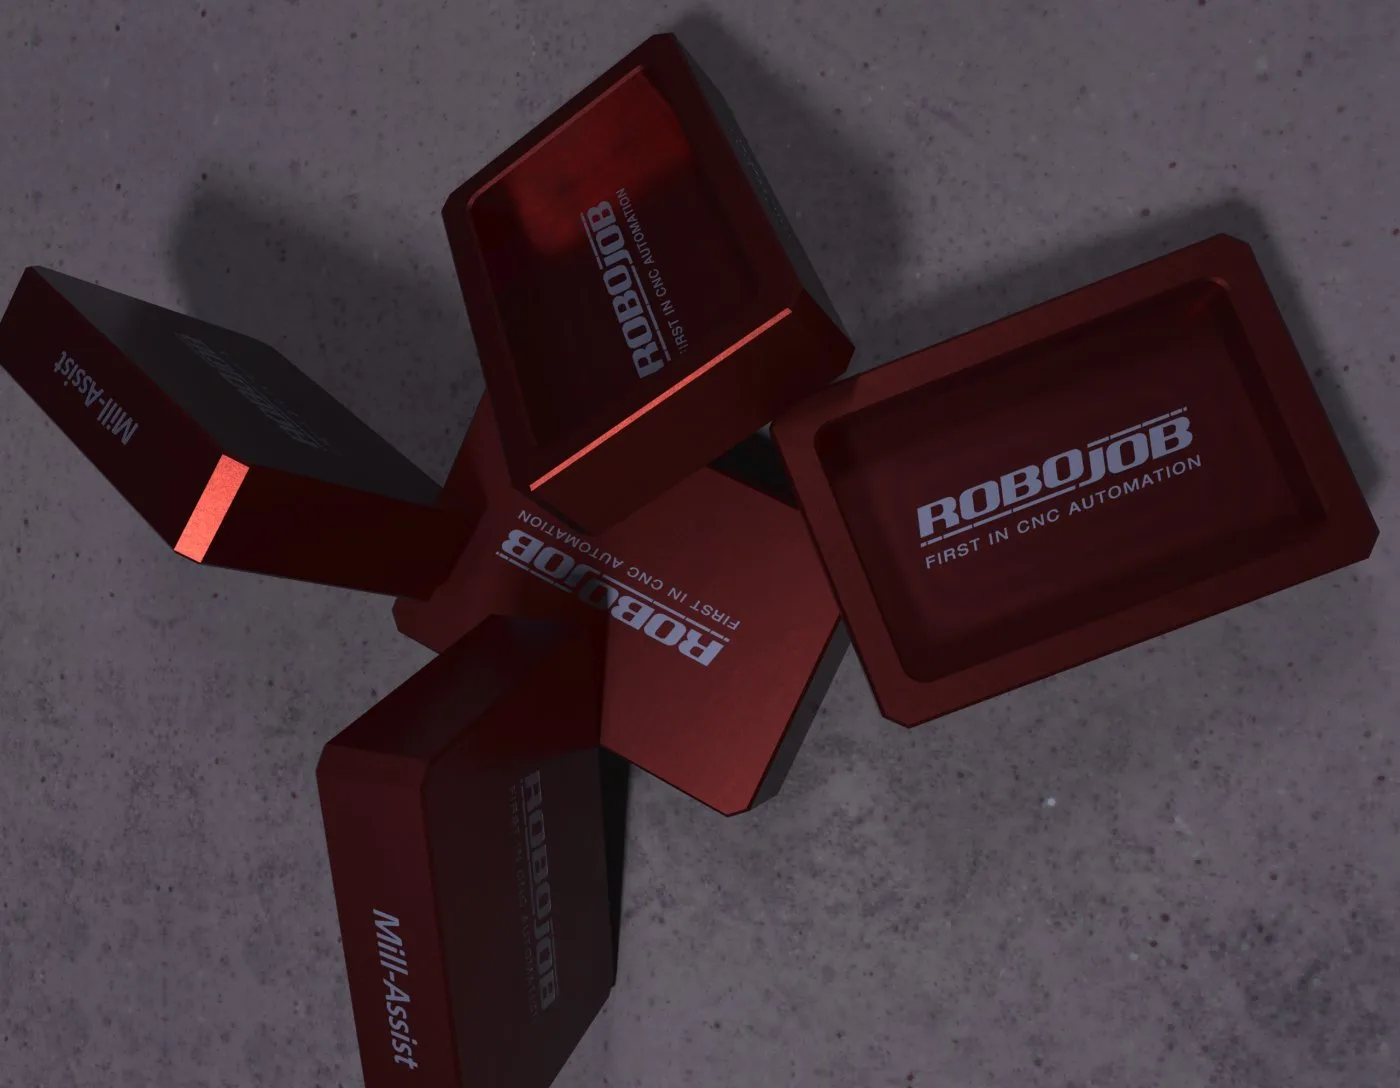 Datanoc
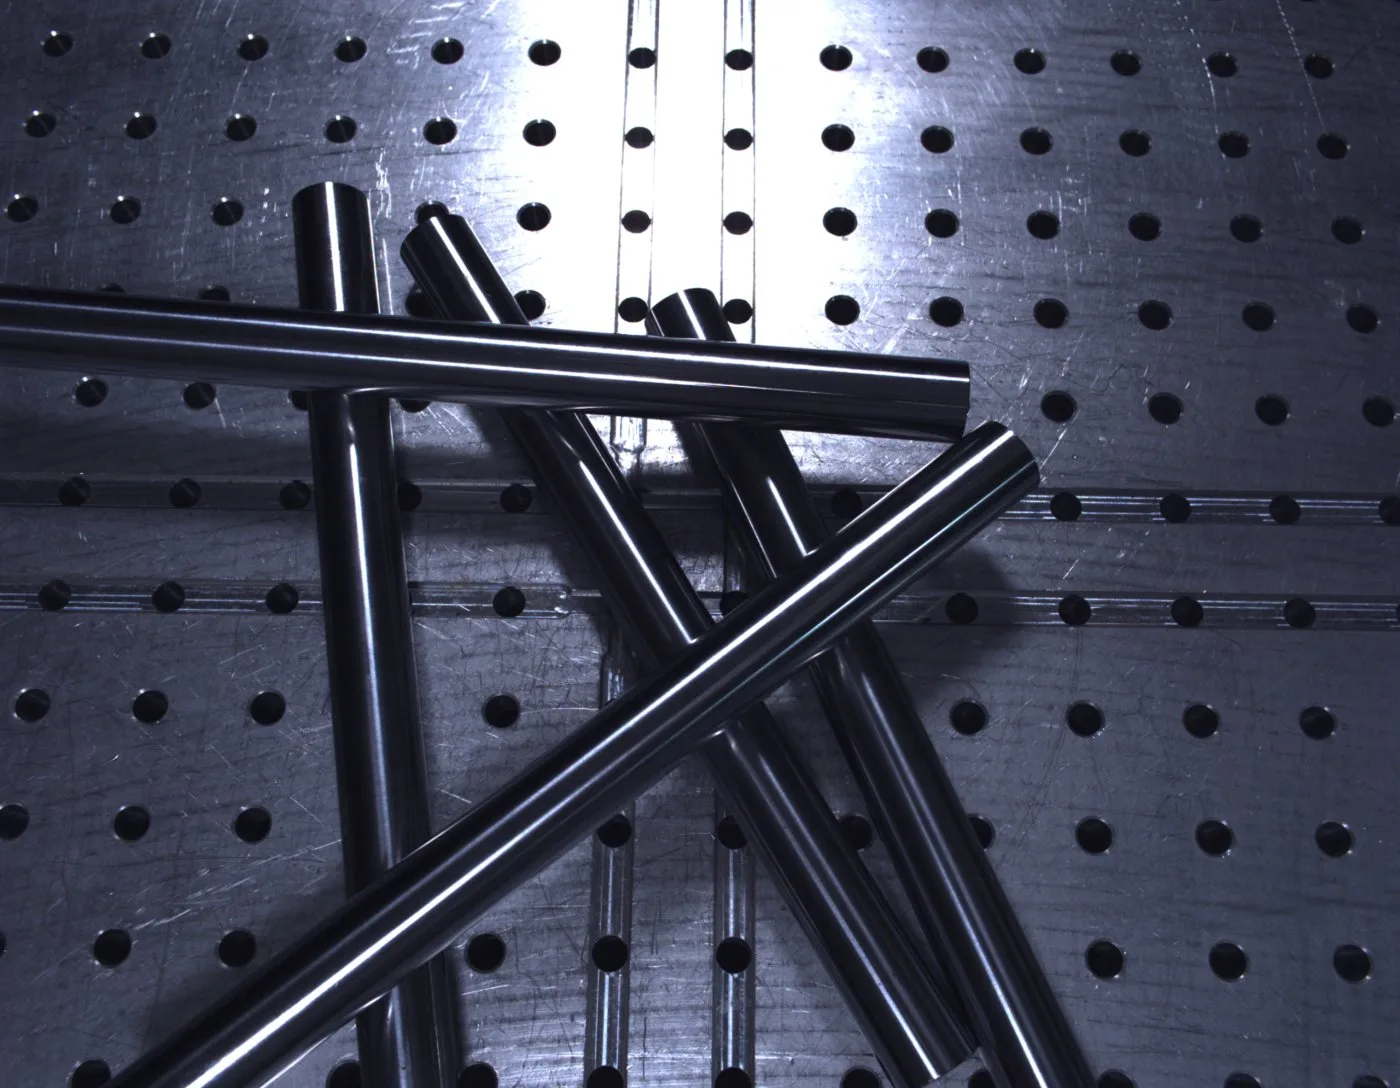 Real
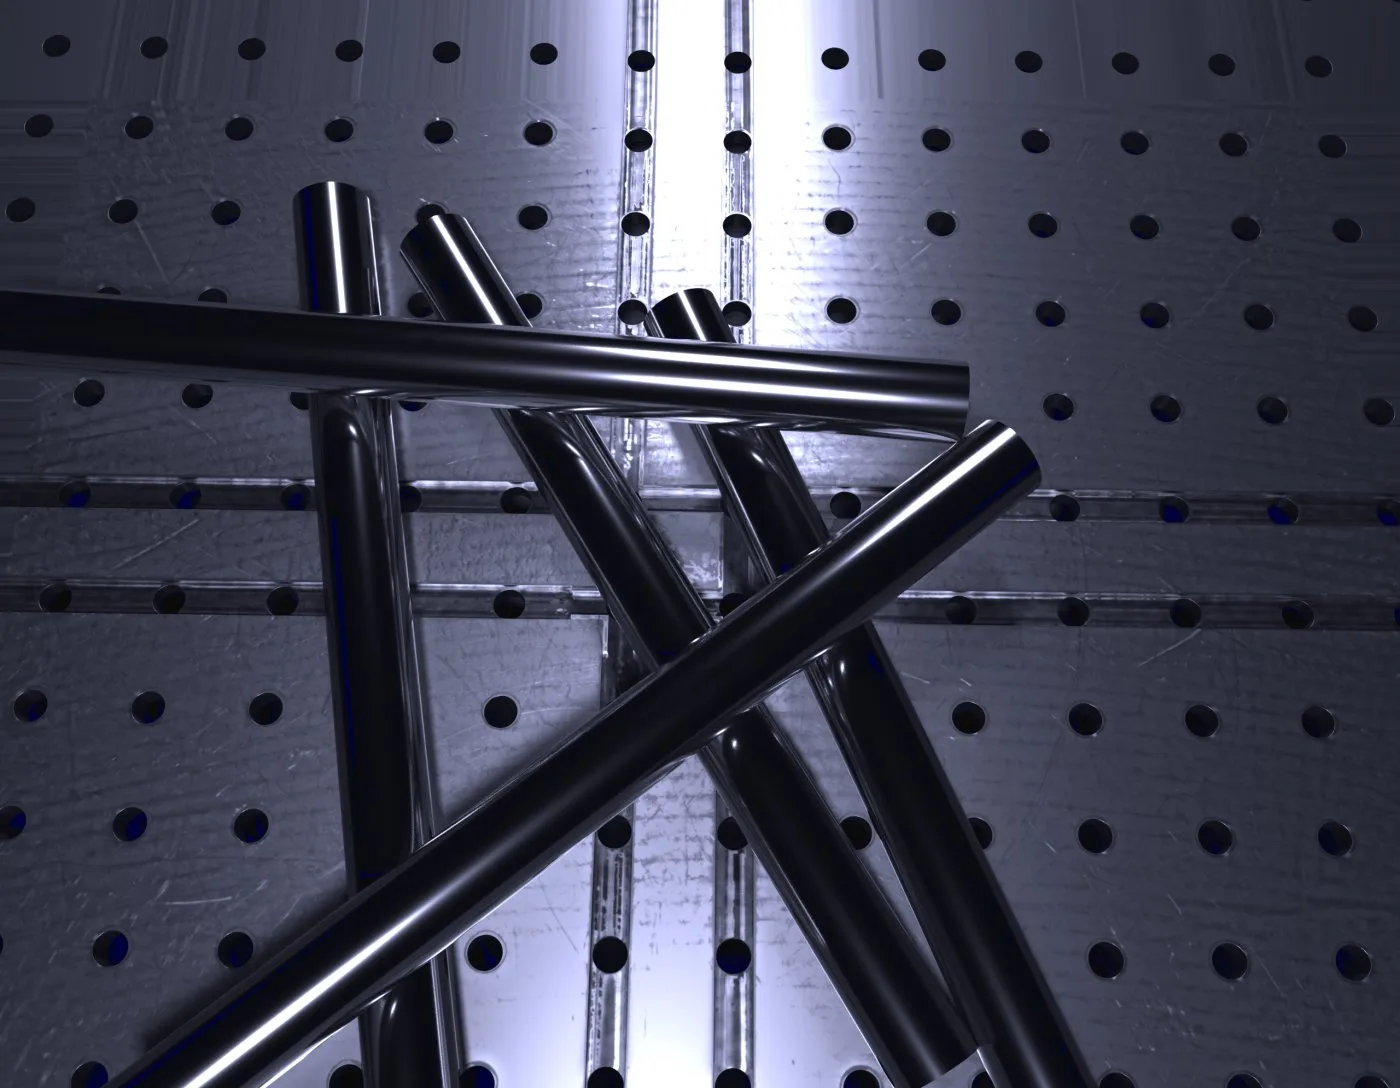 Datanoc
Real images: DIMO, P. De Roovere et al., Dataset of Industrial Metal Objects (2022), licensed under CC BY 4.0.
Real images show the actual parts. Generated images add the scenes the real ones do not cover.
- We model the part and the scene. A 3D model of each part is placed on a digital copy of the carrier, with the camera and light of the real setup.
- We render what the camera would see, from all 13 camera angles, with an exact label for every part.
- We match the generated data to the real data. Our own methods make sure the generated images follow the distribution of the real ones, part by part, while each generated scene still adds variation the real images do not cover. The 3D map on the right shows the result.
Fewer real images, no labelling, and new data when the setup changes.
Start with a few images
15 real images plus generated images outscored 120 real images (0.929 vs 0.911). Even with only one real image per part, generated images brought the score nearly as high as the full real dataset.
Switch carriers, keep the score
On a new carrier the detector dropped from 0.949 to 0.807. Generated images of the new carrier brought it back to 0.921 without a single new real image. With 15 real images added, it matched the full 273 real images (0.933 vs 0.934).
New data when you need it
Need more images, more variety, or a new part on the line? The digital setup is updated and new labelled images follow, instead of waiting for the next round of physical data collection.
No labelling bill
Every generated image comes with precise labels. The 273 generated images of one carrier hold 1,127 labelled parts, eliminating hours of manual labelling. Every extra part, carrier or lighting setup multiplies that count.
Want to see what generated data does for your part?
Tell us the inspection task and the conditions. We will come back with what is feasible, the timeline, and the cost.