
Your detector learned one lighting setup. Synthetic data teaches it the rest.
We trained the same detection models twice: once on real images alone, and once with rendered synthetic images added.
Real data only covers the day you collected it.
Inspection datasets are usually captured in one session, under one lighting setup. A detector trained on them works well until the lighting changes or a camera setting is modified.
A detector trained on 293 real photos of wall plugs was nearly perfect under the lighting it was trained on. Under shifted lighting, it missed plugs in dense piles and reported detections that were wrong. The same model trained with additional imaged rendered from synthetic scenes found more parts and made fewer false detections, even under lighting it had never seen.
Collecting real images for every lighting condition is slow, if not impossible. You only learn which conditions you needed once the change is live, which can cost production time and a retrain and re-validation cycle.

Every model size improved, by a similar margin.
Each row compares the same model trained on the 293 real photos alone, and with 200 synthetic scenes added.
| Model | Detection score | Parts missed | False detections | Score, hardest lighting | ||||||||
|---|---|---|---|---|---|---|---|---|---|---|---|---|
| Real only | + synthetic | Real only | + synthetic | Real only | + synthetic | Real only | + synthetic | |||||
| Nano | 0.881 | 0.951 | +8% | 144 | 82 | −43% | 49 | 8 | −84% | 0.786 | 0.938 | +19% |
| Small | 0.887 | 0.958 | +8% | 175 | 79 | −55% | 59 | 10 | −83% | 0.767 | 0.943 | +23% |
| Medium | 0.898 | 0.949 | +6% | 191 | 87 | −54% | 36 | 8 | −78% | 0.738 | 0.922 | +25% |
| Large | 0.890 | 0.946 | +6% | 172 | 63 | −63% | 42 | 14 | −67% | 0.749 | 0.909 | +21% |
How we measured these numbers
Detection score is mAP50-95 on 60 real test images containing 1,566 parts, across six lighting conditions. Missed parts and false detections are counted over the same images at a confidence threshold of 0.8. Hardest lighting is the darkest of the six conditions (10 images). Reference boxes for the real photos were generated automatically rather than drawn by hand, so the scores measure agreement with those references. Each configuration was trained once.
Simply buying a bigger model did not solve the problem.
On real data alone, the nano, small, medium and large models all scored between 0.88 and 0.90.
More varied data moved the result. More model did not.
The same real test image, two detectors.
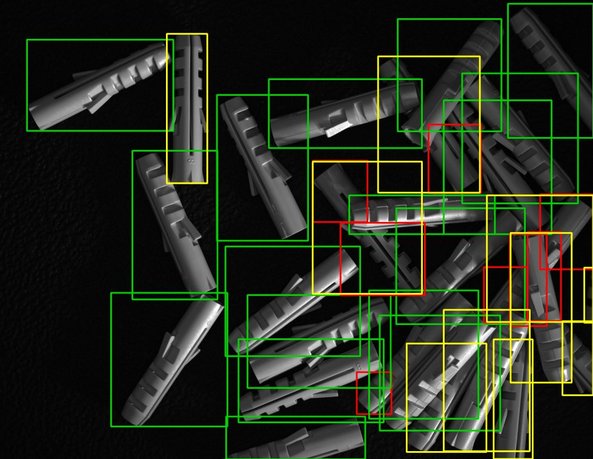 Trained on real only
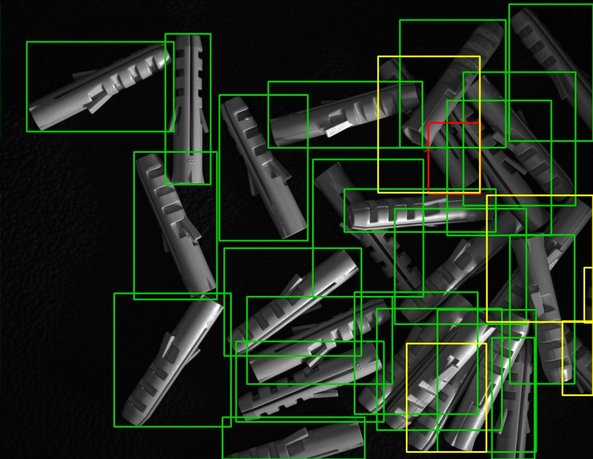 Trained on real + synthetic
Real images keep the model grounded. Synthetic scenes widen what it has seen.
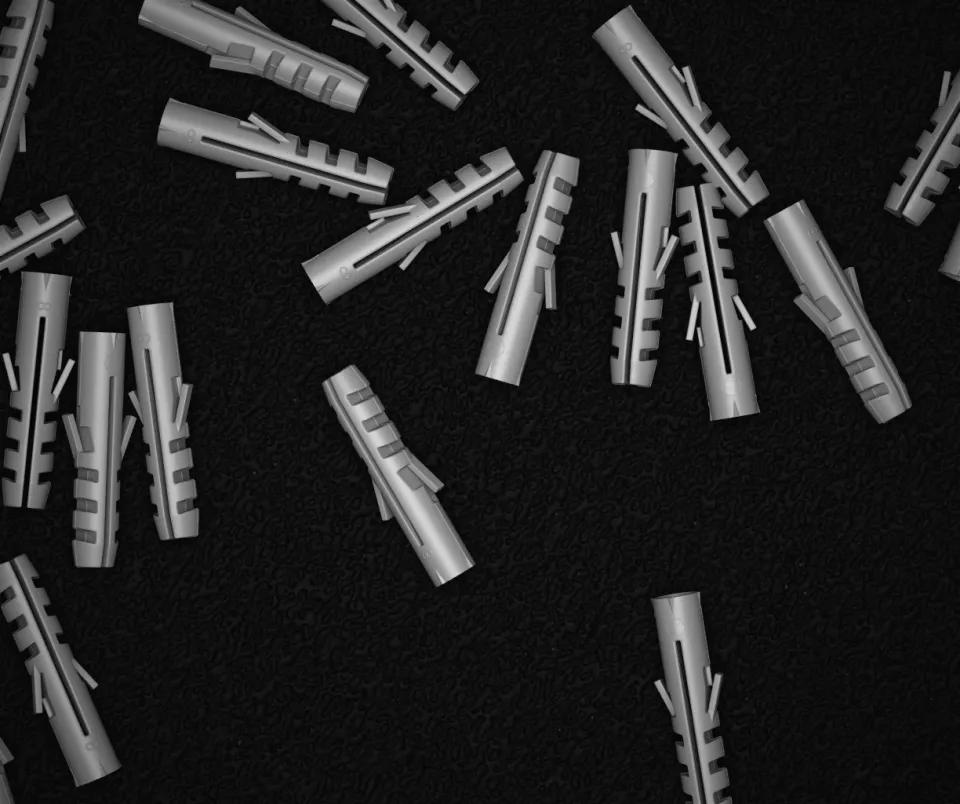
- We model the part and the scene. A 3D model of the wall plug is dropped into a simulated scene with its own camera and light, in random piles of 20 to 40 parts.
- We render what the camera would see, including scenes where the camera and the light are moved, so the training set covers conditions the real photos do not.
- We train on real and synthetic together. The real images keep the model grounded in the actual part. The synthetic scenes widen what it has seen.
Fewer misses, fewer false alarms, and a detector that survives change.
Fewer misses, fewer false alarms
Missed parts fell by 43 to 63%, and false detections by three to six times. Fewer parts slip through uncounted, and fewer stops are needed to check what the system thought it saw.
A detector that survives change
Under the hardest lighting in the test, real-only models dropped to a score of 0.74 to 0.79. With synthetic data they held at 0.91 to 0.94.
Smaller, cheaper hardware
The smallest model trained with synthetic data (0.951) outscored the large model trained on real data alone (0.890). It has a tenth of the parameters and ran about four times faster in our test.
No labelling bill
Every synthetic scene is rendered with exact outlines and boxes for each part. The 200 scenes added more than 5,700 labelled parts without anyone drawing a box.

Want to see what synthetic data does for your part?
Tell us the inspection task and the conditions. We will come back with what is feasible, the timeline, and the cost.